Calculate view factors
In this section, we will learn how to:
calculate the view factor matrix from a PV array object and understand its shape
plot the pvarray with indices to visualize the meaning of the matrix
Note: the following calculation steps are already implemented in the simulation engine PVEngine, please refer to the next tutorials for running complete simulations.
Imports and settings
[1]:
# Import external libraries
import matplotlib.pyplot as plt
import numpy as np
import warnings
warnings.filterwarnings("ignore", category=RuntimeWarning)

# Settings
%matplotlib inline
np.set_printoptions(precision=3)
Prepare PV array parameters
[2]:
pvarray_parameters = {
    'n_pvrows': 2,            # number of pv rows
    'pvrow_height': 1,        # height of pvrows (measured at center / torque tube)
    'pvrow_width': 1,         # width of pvrows
    'axis_azimuth': 0.,       # azimuth angle of rotation axis
    'surface_tilt': 20.,      # tilt of the pv rows
    'surface_azimuth': 90.,   # azimuth of the pv rows front surface
    'solar_zenith': 40.,      # solar zenith angle
    'solar_azimuth': 150.,    # solar azimuth angle
    'gcr': 0.5,               # ground coverage ratio
}
Create a PV array and required attributes
Import the OrderedPVArray class and create a PV array object using the parameters above
[3]:
from pvfactors.geometry import OrderedPVArray

pvarray = OrderedPVArray.fit_from_dict_of_scalars(pvarray_parameters)
[4]:
# Plot pvarray shapely geometries at timestep 0
f, ax = plt.subplots(figsize=(10, 3))
pvarray.plot_at_idx(0, ax)
plt.show()
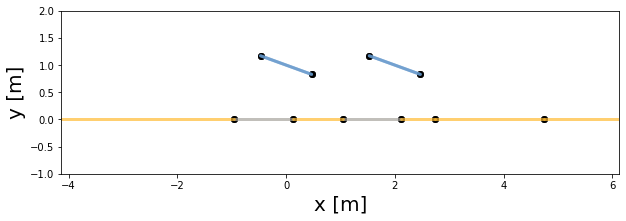
As discussed in the “PV Array geometry introduction” tutorial, the ground also has “cut points” to indicate the limits of what the PV row front and back sides can see.
Calculating the view factor matrix
In order to calculate the view factor matrix, we need to pass the PV array object to view factor calculator method.
Create the view factor calculator.
[5]:
# import view factor calculator
from pvfactors.viewfactors import VFCalculator
# instantiate calculator
vf_calculator = VFCalculator()
[6]:
# calculate view factor matrix of the pv array
vf_matrix = vf_calculator.build_ts_vf_matrix(pvarray)
Important remarks:
the view factor matrix has shape
[n_ts_surfaces + 1, n_ts_surfaces + 1, n_timestamps], wheren_ts_surfacesis the number of timeseries surfaces in the PV array, andn_timestampsis the number of timestampsthe first 2 dimensions have value
n_ts_surfaces+ 1 because the view factors to the sky are also calculated, so the sky is considered like another surface in the mathematical problem
[7]:
print("Number of dimensions: {}".format(vf_matrix.ndim))
print("Shape of vf matrix: {}".format(vf_matrix.shape))
Number of dimensions: 3
Shape of vf matrix: (24, 24, 1)
Here is a function to help make sense of this
[8]:
def select_view_factor(i, j, vf_matrix):
    "Function to print the view factors"
    n = vf_matrix.shape[0] - 1
    vf = vf_matrix[i, j, :]
    # print the view factor
    i = i if i < n else 'sky'
    j = j if j < n else 'sky'
    print('View factor from surface {} to surface {}: {}'.format(i, j, np.around(vf, decimals=2)))
Let’s print some of the view factor values, and check their meaning on a PV array plot with surface indices
[9]:
# View factors from back of leftmost pv row
select_view_factor(17, 0, vf_matrix)
select_view_factor(17, 3, vf_matrix)
select_view_factor(17, 13, vf_matrix)
# View factors from back of rightmost pv row
select_view_factor(21, 3, vf_matrix)
# View factors from front of leftmost pv row
select_view_factor(15, 23, vf_matrix)
# View factors from front of rightmost pv row
select_view_factor(19, 23, vf_matrix)
View factor from surface 17 to surface 0: [0.4]
View factor from surface 17 to surface 3: [0.05]
View factor from surface 17 to surface 13: [0.]
View factor from surface 21 to surface 3: [0.4]
View factor from surface 15 to surface sky: [0.94]
View factor from surface 19 to surface sky: [0.97]
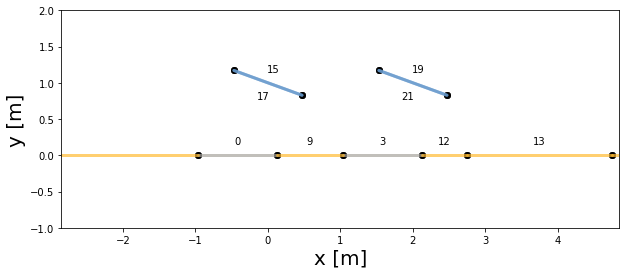
Let’s plot the PV array with the surface indices to understand visually what these numbers mean:
[10]:
# Plot pvarray shapely geometries
f, ax = plt.subplots(figsize=(10, 4))
pvarray.plot_at_idx(0, ax, with_surface_index=True)
plt.show()